Finviz is generally better for fast stock screening, technical analysis, and visual market scanning, while Stock Rover is better for deeper fundamental research, historical financial analysis, and portfolio management. The better choice depends on whether your investing workflow prioritizes speed and market visualization or detailed company research.
Finviz vs Stock Rover at a Glance
Finviz and Stock Rover both help investors find and evaluate stocks, but they are built around different research workflows.
Finviz is particularly strong when you want to scan the market quickly, combine technical and fundamental filters, and understand market movements visually. Its heat maps, screener, charts, and real-time Elite features make it especially useful for fast market discovery and technical-oriented research.
Stock Rover takes a deeper research approach. It combines screening with extensive financial metrics, historical data, portfolio analytics, company comparisons, and advanced screening capabilities. Its current plans extend from hundreds of metrics and years of historical data to much deeper research tools on higher tiers.
The simplest way to think about the difference is:
Finviz helps you find interesting stocks quickly. Stock Rover gives you more tools to investigate what you find.
Quick Comparison
| Category | Finviz | Stock Rover |
|---|---|---|
| Stock Screening | Strong screening across technical and fundamental criteria | Advanced screening with extensive financial metrics |
| Technical Analysis | Strong visual charts, technical filters, and market scanning | Technical analysis available alongside deeper fundamental research |
| Fundamental Research | Useful fundamental filters and company data | More extensive fundamental research and financial metrics |
| Historical Data | Historical information is available, with deeper features in Elite | Strong historical pricing and fundamental data, depending on plan |
| Portfolio Analysis | Portfolio/watchlist functionality | Dedicated portfolio management and analytics |
| ETF Research | ETF screening, data, and holdings in Elite | ETF screening and broader fund research on supported plans |
| Heat Maps | One of Finviz’s standout visual features | Research-focused dashboards and comparative views |
| Custom Screening | Advanced customizable filters in Elite | Ranked, historical, equation-based, and custom screening on higher tiers |
| Pricing | Elite currently starts at $39.50/month or $299.50/year | Plans currently start at $29/month when billed annually |
| Best For | Fast market scanning and visual analysis | Deep research, screening, and portfolio analysis |
Finviz Elite currently includes real-time quotes and charts, advanced screening, ETF and fundamental data, alerts, exports/API access, and other premium features. Its official pricing lists Elite at $39.50 per month or $299.50 per year.
Stock Rover’s annual-billing plans currently begin at $29/month for Premium, with higher tiers adding more metrics, historical data, equation-based screening, advanced ETF screening, research reports, and portfolio capacity.
Quick Verdict
Best for quick market scanning → Finviz
If your first step is scanning hundreds of stocks, spotting market trends, or quickly narrowing a universe using technical and fundamental filters, Finviz is the more natural starting point.
Best for deep fundamental research → Stock Rover
If you want to investigate financial performance, valuation, historical fundamentals, company comparisons, and investment metrics in greater depth, Stock Rover has the stronger research-oriented workflow.
Best for portfolio analysis → Stock Rover
Stock Rover is designed to go beyond finding stocks. Its portfolio tools can connect with supported brokerages and provide performance, correlation, trade-planning, and portfolio-analysis capabilities.
Best for visual market analysis → Finviz
Finviz’s heat maps and market-oriented interface make it particularly effective when you want to understand what is moving across sectors, industries, and individual stocks at a glance.
What Is Finviz?
Finviz is a web-based financial research and market-screening platform built around fast stock discovery and visual market analysis.
Its appeal is straightforward: instead of manually browsing thousands of companies, you can narrow the market using screening criteria and quickly inspect the resulting stocks through charts, tables, and visualizations.
That makes Finviz useful at the discovery stage of an investment workflow.
For example, suppose you want to find US companies with strong recent price performance, a particular market capitalization, and specific valuation characteristics. Rather than opening individual company pages one by one, you can apply filters and work from a much smaller candidate list.
Finviz also puts considerable emphasis on visualization. Its heat maps can help users see how sectors, industries, and individual stocks are behaving across the market. Elite adds real-time data, advanced screening, interactive multi-layout charts, alerts, exports, and additional ETF and fundamental capabilities.
Finviz Core Features
Stock screener
The screener is the center of the Finviz experience. Investors can combine different criteria to narrow down potential stocks.
Technical filters
Technical conditions allow users to screen stocks based on market and price behavior rather than relying exclusively on company fundamentals.
Fundamental filters
Finviz also provides fundamental screening criteria, allowing users to narrow candidates using financial and valuation characteristics.
Market visualization
This is one of Finviz’s most recognizable strengths. Heat maps provide a fast visual overview of market performance.
Charts
Charts allow users to move from a screening result to a closer look at an individual security.
Watchlists
Investors can organize stocks they want to monitor rather than repeatedly rebuilding the same searches.
Alerts
Finviz Elite adds push and email alert capabilities for supported events and data.
Finviz Elite
Elite is the paid version and adds features such as real-time data, advanced charts, advanced screening, ETF and fundamental data, alerts, exports/API access, and an ad-free experience.
Who Is Finviz Best For?
Finviz makes the most sense for investors who want to move quickly from a broad market to a shortlist of candidates.
It can be particularly useful for:
- Active traders
- Swing traders
- Momentum-focused investors
- Investors who rely heavily on screening
- Users who prefer visual market information
- Anyone who wants a fast way to scan sectors and individual stocks
A common mistake is assuming that a strong screener automatically makes a platform a complete investment-research solution. Finviz can help you identify candidates, but deeper due diligence may require additional research sources.
Expert tip: Use Finviz as a candidate-generation tool when speed matters. Once you have a shortlist, investigate the underlying businesses before making an investment decision.
What Is Stock Rover?
Stock Rover is an investment research platform designed to combine stock screening, financial research, comparison, and portfolio analysis in one environment.
Its biggest distinction from a lightweight market screener is the depth of information available for evaluating companies. Depending on the subscription tier, Stock Rover provides hundreds of financial metrics, historical pricing and fundamental data, screening tools, portfolio management, research reports, and advanced analytical features.
Stock Rover’s current platform has also expanded significantly in 2026. Its V12 release introduced features including deeper historical fundamentals, additional metrics and screeners, percentile screening, enhanced research tools, and an integrated options environment on applicable plans.
That makes Stock Rover particularly relevant when the question changes from:
“Which stocks meet my criteria?”
to:
“Which of these companies deserves deeper research?”
Stock Rover Core Features
Stock screening
Stock Rover’s screening system can filter stocks using a large range of financial, operational, price, sector, and industry metrics. Its official documentation describes more than 500 screenable metrics, while current plans advertise substantially larger metric libraries on higher tiers.
Fundamental metrics
Investors can examine measures related to valuation, growth, profitability, financial strength, dividends, and other areas of company performance.
Historical financial data
Higher plans provide increasingly deep historical fundamentals and price history, allowing investors to examine companies across multiple market cycles.
Portfolio analytics
Stock Rover can connect supported brokerage accounts and provide portfolio analysis, performance information, correlation analysis, and trade-planning tools.
Research tools
The platform provides company research capabilities and, on applicable plans, research reports covering thousands of stocks.
ETF analysis
Stock Rover supports ETF screening and, on higher tiers, expanded ETF and fund research.
Watchlists
Screening results can be saved as portfolios or watchlists, making it easier to continue researching candidates over time.
Brokerage connections
Supported plans allow users to connect brokerage accounts for portfolio management and analysis.
Custom equations
Higher-tier plans allow investors to create more advanced screening logic using equations and historical data.
Who Is Stock Rover Best For?
Stock Rover is particularly well suited to investors who want to research companies in depth rather than simply discover them.
That includes:
- Long-term investors
- Fundamental investors
- Value investors
- Dividend investors
- Quantitative investors
- Portfolio-focused investors
- Investors who compare multiple companies before buying
The trade-off is complexity. A platform with hundreds of metrics can be extremely useful, but only if you know which metrics matter to your strategy.
Expert tip: Don’t start with the entire Stock Rover metric library. Start with your investment thesis, define the handful of metrics that support it, and build the workflow around those criteria.
Finviz vs Stock Rover: Key Differences
The biggest difference between Finviz and Stock Rover is not simply the number of features each platform offers. It is how each platform fits into the investment-research process.
Finviz is particularly effective at helping you scan and visualize the market. Stock Rover is built more heavily around detailed research, comparison, historical analysis, and portfolio management.
That distinction becomes clearer when you compare the platforms feature by feature.
Stock Screening
Both platforms can screen stocks, but they approach the task differently.
Finviz is built for fast filtering. You can narrow a large market universe using technical and fundamental criteria, then move quickly into charts or market visualizations.
Stock Rover’s screener is more research-oriented. Its current platform supports extensive financial metrics, ranked screening, historical screening, equation-based screening on applicable plans, and screening across stocks and ETFs.
For a trader looking for a quick momentum setup, Finviz can feel more direct.
For an investor trying to build a detailed value or quality screen using multiple financial conditions, Stock Rover offers more room to construct a sophisticated research model.
Winner for speed and visual discovery: Finviz
Winner for advanced research screening: Stock Rover
Fundamental Analysis
This is where Stock Rover pulls further ahead.
Finviz provides useful fundamental information and allows fundamental criteria to be incorporated into screening. That is enough for many users who simply want to narrow a list of companies.
Stock Rover is designed for investors who want to go further. Its current plans provide hundreds of metrics, historical fundamentals, valuation tools, research reports, stock scores, and additional analytical features depending on the subscription level.
For example, an investor researching a potential long-term holding might want to examine:
- Revenue growth
- Earnings growth
- Profit margins
- Return on equity
- Return on invested capital
- Valuation
- Dividend history
- Financial strength
- Historical performance
The advantage isn’t simply having more numbers on the screen. It is being able to combine those numbers into a repeatable research process.
Winner for deep fundamental research: Stock Rover
Technical Analysis
Finviz has a strong case for investors whose workflow begins with price action.
Its Elite platform includes interactive multi-layout charts, technical studies, automatic pattern recognition, real-time data, and saved technical configurations.
Stock Rover also supports technical analysis and charting, particularly as part of its broader research environment. Its 2026 platform updates added additional charting capabilities and technical research tools.
The difference is less about whether either platform supports technical analysis and more about emphasis.
If technical screening and fast visual market scanning are central to your process, Finviz is the more natural fit.
Winner for a technical-first workflow: Finviz
Historical Financial Data
Historical data becomes important when a snapshot of today’s numbers isn’t enough.
Stock Rover has a clear advantage for users who want deeper historical fundamental research. Its current plans range from five years of historical fundamentals on Premium to 20 years on Ultimate, with price history extending to 20 years on higher plans.
That can help investors ask questions such as:
- Has this company’s margin profile improved?
- Has its valuation changed materially?
- How consistent has its growth been?
- How did the company perform through previous market cycles?
Finviz can still be useful for historical price and financial analysis, particularly through its premium features, but Stock Rover is more explicitly structured around longitudinal company research.
Winner for deep historical fundamental analysis: Stock Rover
Portfolio Management
This is another area where Stock Rover has a distinct advantage.
Stock Rover is designed to connect research with the portfolio itself. Supported plans include brokerage integration, portfolio tracking, performance analysis, correlation tools, trade planning, and rebalancing-related functionality.
Finviz can be useful for maintaining watchlists and monitoring securities, but its core identity remains market discovery and screening rather than comprehensive portfolio management.
For someone who wants one environment for researching investments and analyzing an existing portfolio, Stock Rover is the stronger choice.
Winner for portfolio analysis: Stock Rover
ETF and Fund Research
Both platforms can be useful for ETF research, but their depth differs by platform and subscription.
Finviz Elite includes ETF data, including holdings breakdowns and performance and structural metrics.
Stock Rover offers ETF screening and increasingly broad fund research. Its current plans cover thousands of ETFs and mutual funds, while higher tiers add expanded ETF and fund reports and screening capabilities.
If ETF research is part of a broader portfolio-analysis workflow, Stock Rover has the stronger overall research environment.
Winner for broader ETF/fund research: Stock Rover
Finviz vs Stock Rover Stock Screener Comparison
If the stock screener is the main reason you’re comparing these platforms, the decision becomes more nuanced.
Both can reduce thousands of securities to a manageable shortlist. The difference is what happens after the filters are applied and how sophisticated you want those filters to become.
Finviz emphasizes speed and accessibility. Stock Rover emphasizes depth, ranking, historical analysis, and customizable investment logic.
Finviz Screening Workflow
A typical Finviz workflow is straightforward:
Market → Filters → Results → Charts → Shortlist
You begin with the screener and apply criteria that match your strategy. Depending on what you are looking for, those criteria can include valuation, market capitalization, performance, technical conditions, sector, industry, and other characteristics.
The resulting list can then be reviewed using Finviz’s visual tools and charts.
This is particularly useful when you have a broad question such as:
“Which US stocks are showing strong momentum while meeting my valuation requirements?”
Instead of researching individual companies first, you screen the market and investigate the resulting candidates.
Finviz Elite expands this workflow with additional customizable filters, advanced charting, real-time information, alerts, and export/API capabilities.
Best use case: Rapid candidate discovery.
Stock Rover Screening Workflow
Stock Rover takes a more analytical route:
Investment criteria → Screener → Ranking → Comparison → Research → Watchlist/Portfolio
The platform allows investors to work with a broad set of financial and operational metrics. Its screening tools can also rank results, while higher-tier plans add historical screening and equation-based screening.
For example, instead of simply filtering companies that have a certain return on equity, an investor can construct a broader quality screen combining several measures and then rank the resulting companies.
Stock Rover also allows screening results to be saved as portfolios or watchlists, and results can be exported for further analysis.
Best use case: Building repeatable, research-heavy investment screens.
Which Screener Is More Powerful?
That depends on what “powerful” means for your strategy.
If powerful means fast, accessible market discovery with strong visual analysis, Finviz has the advantage.
If powerful means more financial metrics, ranking, historical screening, custom equations, and deeper investment logic, Stock Rover has the stronger toolset.
Stock Rover’s current screening system supports hundreds of metrics, with higher plans offering 700–800+ metrics, historical screening, equation-based screening, ranked screening, and advanced ETF screening.
A useful way to think about it:
Finviz asks:
“What stocks match these conditions right now?”
Stock Rover lets you ask:
“Which companies match these conditions, how do they rank against each other, and how have these characteristics changed over time?”
That difference matters more than raw filter counts.
Verdict: Stock Rover is the stronger choice for advanced, research-heavy screening. Finviz is the stronger choice when speed and visual market discovery are the priority.
Which Screener Is Easier to Use?
Finviz generally has the simpler learning curve for users who want to open a screener, apply filters, and immediately inspect results.
Its visual layout makes the relationship between screening, charts, and market performance relatively easy to understand.
Stock Rover offers considerably more flexibility, but that flexibility comes with additional complexity. Investors have more metrics, ranking options, historical capabilities, portfolio connections, and customization choices to learn.
That creates an important trade-off:
| If you value… | Better fit |
|---|---|
| Fast setup | Finviz |
| Visual simplicity | Finviz |
| Quick market scanning | Finviz |
| Large metric selection | Stock Rover |
| Advanced screening logic | Stock Rover |
| Historical screening | Stock Rover |
| Ranked screening | Stock Rover |
| Research-to-portfolio workflow | Stock Rover |
The common mistake is choosing the platform with the largest feature list simply because it appears more sophisticated.
Choose the screener that matches the decisions you actually make.
If your process takes five minutes to identify candidates and then moves elsewhere for research, Finviz may be all you need.
If screening is a major part of your investment methodology and you want the screener to connect directly to deeper financial research and portfolio analysis, Stock Rover is likely the better fit.
Finviz vs Stock Rover for Fundamental Analysis
If your goal is to understand why a company may be worth owning, rather than simply finding a stock that matches a filter, Stock Rover has the stronger fundamental-research workflow.
Finviz still provides useful fundamental data and screening criteria, making it effective for quickly narrowing a large universe of stocks. Stock Rover goes further by combining financial metrics with historical fundamentals, valuation analysis, company comparisons, research reports, and portfolio tools. Its current plans range from 400+ metrics and five years of fundamentals on Premium to 800+ metrics and 20 years of fundamentals on Ultimate.
| Fundamental Area | Finviz | Stock Rover |
|---|---|---|
| Valuation screening | Strong | Advanced |
| Growth metrics | Strong | Extensive |
| Profitability analysis | Good | Extensive |
| Historical fundamentals | More limited | 5–20 years depending on plan |
| Valuation history | Available | Advanced |
| Company comparison | Good | Advanced |
| Research reports | No equivalent full research-report system | Available on eligible plans |
| Fair value analysis | Limited | Available on eligible plans |
| Best suited to | Fast candidate discovery | Deep company research |
Valuation Metrics
Both platforms can help investors evaluate valuation, including measures such as P/E, P/B, EV/EBITDA, and dividend yield. The practical difference is what you can do with those numbers afterward.
Finviz is well suited to filtering the market for companies that meet specific valuation conditions. Stock Rover is better suited to examining valuation in a broader historical and comparative context, including valuation ranges and ratio charts on applicable plans.
Best for quick valuation screening: Finviz
Best for deeper valuation research: Stock Rover
Growth and Profitability Metrics
For growth and quality analysis, Stock Rover offers a broader research environment. Investors can examine metrics related to revenue, earnings, margins, efficiency, financial strength, dividends, and other dimensions of company performance. Its higher-tier plans also provide stock scores covering areas such as growth, value, quality, and other investment characteristics.
Finviz remains useful when you want to quickly filter for characteristics such as earnings growth, sales growth, margins, ROE, or other fundamental conditions.
The distinction is simple: Finviz helps narrow the list; Stock Rover gives you more room to interrogate the companies on that list.
Historical Fundamentals
Historical data is particularly valuable when a company’s current numbers look attractive but you want to know whether that strength is consistent.
Stock Rover currently provides five years of historical fundamentals on Premium, 10 years on Premium Plus, and 20 years on Ultimate. Its higher-tier charting tools are designed to combine fundamental history, valuation ranges, price performance, and technical information in the same research environment.
That makes it easier to investigate questions such as:
- Has revenue growth been consistent?
- Have margins improved or deteriorated?
- Is today’s valuation unusually high or low?
- How did the company behave during previous market cycles?
For investors who make decisions from long-term financial trends, this depth is one of Stock Rover’s clearest advantages.
Best Platform for Fundamental Investors
Verdict: Stock Rover
Choose Finviz if you mainly need fundamental filters to discover potential candidates.
Choose Stock Rover if fundamental research is central to your investment process and you want historical data, deeper metrics, valuation context, company comparisons, and portfolio analysis in the same platform.
Expert tip: Don’t judge a fundamental-research platform by how many metrics it displays. Start with your investment thesis, identify the metrics that actually test that thesis, and then choose the platform that lets you analyze them efficiently.
Finviz vs Stock Rover for Technical Analysis
Technical analysis creates a closer comparison because both platforms now offer charting and technical research capabilities. The difference is primarily one of emphasis.
Finviz has traditionally been particularly useful for fast technical screening and visual market scanning, while Stock Rover combines technical analysis with its broader fundamental and portfolio-research environment. Stock Rover’s current charting system includes technical indicators alongside long-term fundamentals, valuation ranges, and price history.
Technical Indicators
Finviz Elite provides interactive charts with technical studies and automatic pattern recognition, alongside customizable screening and real-time data.
Stock Rover also supports technical analysis and support-level research. Its 2026 V12 update expanded charting capabilities and added features such as analyst-rating overlays and custom chart tools on Ultimate.
For a technical-first workflow, Finviz has the more natural fit.
Charts and Price Analysis
Finviz is designed to move quickly from a screener result to a chart. That makes it convenient when you’re scanning many stocks and want to inspect price behavior without building a lengthy research workflow.
Stock Rover takes a more integrated approach. Its charting engine can combine price history with fundamental data, valuation ranges, dividends, benchmarks, and technical indicators.
So the choice depends on what you want the chart to answer.
“Is this stock showing an interesting technical setup?” → Finviz
“How does this stock’s price relate to its fundamentals and historical valuation?” → Stock Rover
Momentum and Volume Screening
Finviz is particularly useful when momentum screening is part of the initial stock-discovery process. Its screener lets users combine price-performance and technical conditions with other filters.
Stock Rover can also incorporate technical and performance metrics into broader screening workflows, but its strength becomes more apparent when those signals are evaluated alongside fundamental and portfolio data.
For example, a trader may want to find stocks showing strong recent price performance and volume characteristics. A long-term investor may instead want to use momentum as one input among many when evaluating a fundamentally strong company.
Best Choice for Active Traders
Verdict: Finviz
Finviz is the better fit when your workflow is built around rapid screening, technical conditions, charts, and visual market analysis.
Stock Rover makes more sense when technical signals are only one part of a broader investment process that also includes fundamentals, valuation, historical analysis, and portfolio management.
Finviz vs Stock Rover for Portfolio Management
The comparison changes significantly once you move from finding stocks to managing the investments you already own.
Stock Rover has a much stronger portfolio-management focus. Its paid plans include portfolio management with brokerage integration, and the platform has continued expanding its portfolio analytics in 2026, including a Portfolio Performance Report designed to summarize holdings, performance, risk, and income-related information.
Portfolio Tracking
Stock Rover lets investors connect supported brokerage accounts and analyze their holdings inside the platform. Depending on the plan, users can manage multiple portfolios and work with different brokerage connections.
Finviz is more naturally suited to monitoring stocks, watchlists, and market conditions than serving as a full portfolio-analysis workspace.
If your question is:
“What stocks should I investigate?”
Finviz is useful.
If your question is:
“How is my existing portfolio performing and where are my risks?”
Stock Rover has the stronger answer.
Portfolio Analytics
Stock Rover’s portfolio tools go beyond displaying current positions. Its platform is designed around performance analysis, portfolio comparison, correlation, trade planning, rebalancing, and other portfolio-management workflows.
This matters when your portfolio contains multiple stocks, ETFs, or investment strategies and you need to understand how the pieces interact.
Brokerage Integration
Stock Rover supports brokerage integration on its paid plans, with the number of supported connections and portfolios varying by subscription tier.
That creates a more connected workflow:
Brokerage → Portfolio → Analytics → Research → Rebalancing
Finviz does not occupy that same portfolio-management role.
Portfolio Monitoring
For investors who want to monitor an existing portfolio rather than simply watch individual securities, Stock Rover is the clear choice between the two.
Winner for portfolio management: Stock Rover
Winner for market/watchlist monitoring: Finviz
Finviz vs Stock Rover Pricing
Price comparisons need to be handled carefully because both platforms offer different feature tiers, billing options, and periodically changing product structures.
As of September 2026, Finviz Elite lists a seven-day trial, followed by $39.50/month on monthly billing or $299.50/year on annual billing. Stock Rover currently lists Premium at $29/month when billed annually, Premium Plus at $49/month, and Ultimate at $79/month; monthly prices are higher.
| Pricing Factor | Finviz | Stock Rover |
|---|---|---|
| Free access | Yes | Yes |
| Free trial | 7-day Elite trial | 14-day paid-plan trial |
| Entry paid plan | Elite | Premium |
| Annual-billing price | $299.50/year | Premium: $348/year |
| Higher tiers | Single Elite paid tier | Premium Plus, Ultimate, Ultimate Pro |
| Main paid advantage | Advanced screening, real-time data, charts, alerts | Deeper metrics, historical data, portfolio tools, advanced research |
Finviz Free vs Paid
Finviz’s free experience is useful for basic market exploration and screening, while Elite is designed for users who need more advanced functionality.
Elite adds real-time quotes and charts, advanced screening, ETF and fundamental data, alerts, exports/API access, and an ad-free interface. The current official price is $39.50/month or $299.50/year.
The key question is whether you need those premium features regularly.
If you only use Finviz occasionally to discover stocks, the free experience may be sufficient. If real-time information, advanced charts, alerts, exports, and expanded screening are part of your daily workflow, Elite becomes easier to justify.
Stock Rover Free vs Paid
Stock Rover’s paid plans scale by research depth rather than offering one premium tier.
Premium currently provides 400+ metrics, five years of fundamentals, 10 years of price history, screening, portfolio management, brokerage integration, and other research features. Premium Plus expands the research depth to 700+ metrics, 10 years of fundamentals, 20 years of price history, historical and equation-based screening, advanced ETF screening, and research reports. Ultimate extends this further to 800+ metrics and 20 years of fundamentals.
What Do You Actually Get by Paying?
With Finviz, the paid upgrade is primarily about more powerful market discovery and real-time workflow features.
With Stock Rover, upgrading progressively increases research depth, historical data, screening sophistication, portfolio capacity, and analytical tools.
That distinction is useful when deciding which subscription represents better value.
Which One Offers Better Value?
There is no universal winner.
Finviz offers stronger value if you mainly need fast screening, technical analysis, visualization, and real-time market tools.
Stock Rover offers stronger value if you will actually use its deeper fundamentals, historical data, portfolio analytics, and advanced screening capabilities.
Don’t pay for the platform with the longest feature list. Pay for the workflow you will use repeatedly.
Finviz vs Stock Rover for Different Types of Investors
The best platform depends heavily on how you make investment decisions. A momentum trader and a dividend investor can look at the same two platforms and reasonably reach different conclusions.
| Investor Type | Better Fit | Main Reason |
|---|---|---|
| Beginner market scanner | Finviz | Simpler discovery workflow |
| Day trader | Finviz | Fast technical screening and visual analysis |
| Swing trader | Finviz | Screening, momentum and chart workflow |
| Long-term investor | Stock Rover | Deeper fundamentals and historical research |
| Value investor | Stock Rover | Valuation and fundamental depth |
| Dividend investor | Stock Rover | Dividend and portfolio research |
| Quantitative investor | Stock Rover | Advanced screening and custom research capabilities |
For Beginners
For someone learning how to screen stocks, Finviz can be easier to approach because its primary workflow is straightforward: choose filters, review results, inspect charts, and create a shortlist.
Stock Rover is more appropriate when a beginner is ready to build a deeper research process. Its larger metric library can be an advantage, but it can also create unnecessary complexity if the investor doesn’t yet know which metrics matter.
Best starting point for simplicity: Finviz
For Day Traders
Day traders typically care more about price movement, technical conditions, volume, momentum, and fast market scanning.
Finviz is better aligned with that workflow, particularly through its Elite features such as real-time data, interactive charts, technical studies, and advanced screening.
Best fit: Finviz
For Swing Traders
Swing traders often sit between pure day trading and long-term investing.
They may want to identify stocks showing momentum, then validate those candidates using charts, valuation, earnings, and other company information.
Finviz is a strong starting point for rapid candidate discovery. Stock Rover becomes more attractive if fundamental analysis plays a significant role in the final selection.
Best fit for technical-first swing trading: Finviz
Best fit for fundamental-plus-technical swing strategies: Stock Rover
For Long-Term Investors
Long-term investors generally benefit more from historical financial context, valuation analysis, business-quality metrics, and portfolio management.
Stock Rover is designed around that broader research process. Its current plans provide progressively deeper historical fundamentals and price history, with Ultimate extending fundamental history to 20 years.
Best fit: Stock Rover
For Value Investors
Value investors often need more than a low P/E ratio.
They may want to compare valuation against historical ranges, assess profitability and financial strength, and determine whether a stock appears attractive relative to its peers.
Stock Rover’s combination of fundamental metrics, historical data, valuation analysis, and research tools makes it the stronger choice for this workflow.
Best fit: Stock Rover
For Dividend Investors
Dividend investors may care about yield, dividend history, payout characteristics, financial strength, growth, and portfolio income.
Stock Rover provides deeper portfolio and historical research capabilities, while its higher plans include extended dividend history and additional fund and stock research.
Best fit: Stock Rover
For Quantitative Investors
Quantitative investors typically need repeatable screening logic rather than a simple list of filters.
Stock Rover’s higher tiers support equation-based screening, historical screening, ranked screening, custom metrics, and larger research datasets.
Best fit: Stock Rover
Hands-On Finviz vs Stock Rover Test
A useful comparison should go beyond feature lists. The fairest way to evaluate these platforms is to give both the same investment problem and compare how efficiently each handles it.
Test Methodology
Use identical criteria and the same US stock universe wherever the platforms allow it.
For each test, evaluate:
- How easily the criteria can be created
- How much customization is available
- How quickly candidates can be narrowed
- How easy the results are to compare
- What additional research is available after screening
- Whether the workflow supports the next investment decision
The goal is not to declare that one platform produces “better stocks.” Neither platform can make that claim objectively. The test should measure research workflow and usability, not investment performance.
Test 1 — Value Stocks
Example objective: Find established US companies trading at relatively attractive valuations while maintaining acceptable profitability.
Potential criteria:
- P/E
- P/B
- EV/EBITDA
- Profit margin
- ROE
- Revenue or earnings growth
Finviz: Useful for rapidly narrowing the universe using valuation and fundamental filters.
Stock Rover: Better suited when the next step involves deeper historical valuation, company comparison, financial quality, and additional research.
Test winner for rapid discovery: Finviz
Test winner for deeper validation: Stock Rover
Test 2 — Growth Stocks
Example objective: Identify companies with strong revenue and earnings growth while avoiding obviously weak financial profiles.
Potential criteria:
- Revenue growth
- EPS growth
- Profit margins
- ROE/ROIC
- Valuation
Finviz can quickly create a candidate list.
Stock Rover becomes more useful when the investor wants to examine growth consistency over several years and compare companies using a broader set of financial metrics.
Best workflow for discovery: Finviz
Best workflow for deeper growth research: Stock Rover
Test 3 — Momentum Stocks
Example objective: Find stocks displaying strong recent price performance and technical characteristics.
Potential criteria:
- Recent price performance
- Moving-average conditions
- Volume
- Relative performance
- Market capitalization
This is where Finviz’s visual and technical workflow becomes particularly compelling. Its Elite platform combines advanced screening with interactive charts, technical studies, pattern recognition, and real-time market data.
Stock Rover can incorporate technical information into a broader research workflow, but its core advantage is not rapid technical scanning.
Test winner: Finviz
Test 4 — Dividend Stocks
Example objective: Find dividend-paying companies that combine income with acceptable financial characteristics.
Potential criteria:
- Dividend yield
- Dividend history
- Payout metrics
- Earnings growth
- Profitability
- Financial strength
Both platforms can contribute to the initial screen, but Stock Rover is better positioned for the deeper research stage because dividend analysis can be combined with historical fundamentals, valuation, portfolio analytics, and extended dividend history on higher plans.
Test winner for deeper dividend research: Stock Rover
What We Learned
The testing framework points to a broader conclusion:
Finviz is strongest when the job is to rapidly reduce a large market universe to a shortlist.
Stock Rover is strongest when the job is to investigate, compare, and monitor those candidates in greater depth.
That means the platforms don’t have to be viewed as direct substitutes in every workflow.
An investor could reasonably use Finviz for discovery and Stock Rover for due diligence, provided the additional subscription cost is justified by their research needs.
Finviz vs Stock Rover: Pros and Cons
Neither platform is universally better. Each has a different center of gravity.
Finviz Pros and Cons
Pros
- Fast stock discovery
- Strong visual market scanning
- Useful technical and fundamental screening
- Effective heat maps
- Straightforward workflow
- Advanced real-time features through Elite
- Strong fit for active and technical-oriented users
Cons
- Less focused on deep portfolio analysis
- Advanced functionality requires Elite
- Investors conducting extensive fundamental research may want additional tools
- Feature depth is concentrated around screening, visualization, and market analysis
Stock Rover Pros and Cons
Pros
- Deep fundamental research
- Extensive financial metrics
- Historical fundamental data
- Advanced screening
- Portfolio management
- Brokerage integration
- Company and investment comparison
- Research reports on eligible plans
- Strong fit for long-term and research-heavy investors
Cons
- More complex learning curve
- Higher-tier features can become expensive
- Many available metrics can overwhelm new investors
- Some of its most advanced research capabilities require higher subscription tiers
The practical choice is therefore less about finding the platform with the most features and more about finding the platform whose features match your actual investing process.
Common Mistakes When Choosing a Stock Research Platform
Choosing a research platform based on a feature checklist alone can lead to an expensive subscription that adds little value to your actual workflow.
Choosing Based Only on Number of Features
A platform with hundreds of metrics isn’t automatically better for every investor.
If you only use six metrics, having access to 800 doesn’t improve your process by itself.
Better approach: Identify the decisions you make repeatedly, then choose the platform that handles those decisions efficiently.
Paying for Features You Don’t Use
A trader who only needs screening and technical charts may not benefit from paying for extensive portfolio analytics.
Likewise, a long-term investor may gain little from paying for features designed around rapid technical market scanning.
Better approach: Start with the free version or trial, recreate your normal workflow, and upgrade only when a paid feature solves a real problem.
Confusing Screening With Investment Research
A screener can tell you that a stock meets your criteria.
It cannot tell you everything you need to know about the business.
A low P/E ratio, high ROE, or strong momentum signal is a starting point for investigation—not a complete investment thesis.
Better approach: Use screening to reduce the universe, then investigate the underlying company, financial statements, valuation, risks, and competitive position.
Choosing a Platform Based on Someone Else’s Strategy
A day trader, dividend investor, and long-term value investor can legitimately prefer different platforms.
Copying another investor’s tool stack without understanding their workflow can result in paying for features that don’t fit your strategy.
Better approach: Start with your own investment process:
How do I find candidates? → How do I evaluate them? → How do I monitor them? → How do I manage my portfolio?
Then choose the platform that supports those steps.
Ignoring Portfolio Management Needs
It’s easy to focus on the screener because that is where stock research begins.
But your needs may change after you buy.
If you need portfolio tracking, brokerage connections, performance analysis, risk monitoring, and rebalancing tools, those requirements should be part of the buying decision from the beginning.
Expert tip: Choose your research platform based on the entire workflow—not just the first 10 minutes of finding a stock.
When Should You Use Finviz Instead of Stock Rover?
Finviz makes more sense when your priority is speed, market discovery, and visual screening rather than deep company research.
Choose Finviz if most of these statements describe your workflow:
- ☐ You prioritize quick stock discovery. You want to move from a broad market universe to a shortlist quickly.
- ☐ You rely heavily on technical filters. Price performance, RSI, moving averages, volatility, volume, and chart patterns are central to your process.
- ☐ You prefer visual market analysis. Finviz’s heat maps, charts, and visual market displays make it easier to spot sector trends and unusual market activity.
- ☐ You want a simpler workflow. If you mainly need to screen, inspect charts, and create a watchlist, Stock Rover’s deeper research tools may be more than you need.
- ☐ You frequently scan large numbers of stocks. Finviz is particularly useful when the first question is, “What is happening in the market right now?”
A typical Finviz workflow looks like this:
Market → Screener → Filters → Charts → Shortlist
For traders and investors who already know what technical or market characteristics they are looking for, that speed can be more valuable than having hundreds of additional research metrics.
Best fit: technical traders, swing traders, market scanners, and investors who want fast idea generation.
When Should You Use Stock Rover Instead of Finviz?
Stock Rover becomes the stronger choice when stock discovery is only the beginning and you need to understand why a company deserves further research.
Choose Stock Rover if most of these statements apply:
- ☐ You perform deep fundamental research. You want to examine profitability, valuation, financial strength, growth, dividends, and other company metrics together.
- ☐ You need historical financial data. Historical fundamentals can help you evaluate whether a company’s current numbers are normal, improving, or deteriorating.
- ☐ You analyze portfolios. Stock Rover goes beyond finding stocks by providing portfolio analysis, performance tracking, risk information, and monitoring tools.
- ☐ You compare companies extensively. Side-by-side financial analysis is useful when choosing between businesses operating in the same industry.
- ☐ You need advanced fundamental screening. Investors building detailed value, growth, quality, or dividend screens can benefit from Stock Rover’s larger metric library and higher-tier screening capabilities.
- ☐ You invest primarily for the long term. If your holding period is measured in years rather than days or weeks, fundamental and historical context becomes much more important.
A typical Stock Rover workflow looks more like:
Universe → Screen → Research → Compare → Analyze Portfolio → Monitor
Best fit: long-term investors, value investors, dividend investors, fundamental analysts, and quantitative investors.
Can You Use Finviz and Stock Rover Together?
You do not necessarily have to choose one.
For some investors, Finviz and Stock Rover work better as complementary tools because they solve different parts of the research process.
Instead of asking which platform is universally better, ask which platform should handle each stage of your workflow.
Discovery With Finviz
Start with Finviz when you need to find potential opportunities quickly.
For example, you could screen for stocks with strong recent performance, unusual volume, a specific market capitalization, or particular technical characteristics. The goal is not to make an investment decision immediately. It is to create a manageable list of candidates.
Finviz = idea generation.
Research With Stock Rover
Take that shortlist into Stock Rover for deeper analysis.
You can examine valuation, revenue and earnings trends, profitability, dividends, financial strength, historical metrics, and other fundamental characteristics. You can also compare several candidates using the same criteria.
Stock Rover = investment research.
Portfolio Monitoring With Stock Rover
Once you actually own the stocks, Stock Rover can become the central portfolio tool.
Instead of repeatedly screening the entire market, you can focus on the companies already in your portfolio and monitor their performance, fundamentals, income, risk, and other relevant metrics.
Stock Rover = portfolio analysis and monitoring.
When Using Both Makes Sense
Using both platforms makes the most sense when your strategy has separate discovery and decision-making stages.
A practical workflow is:
Finviz → Find candidates → Stock Rover → Research candidates → Compare → Buy/Reject → Stock Rover → Monitor
You probably do not need both if your investing process is very simple. But if you actively search for new ideas while also performing detailed fundamental research and portfolio analysis, combining the two can reduce the need to force one platform to do everything.
Alternatives to Finviz and Stock Rover
Finviz and Stock Rover are not the only options for stock research. The better alternative depends on what you value most: charting, macro research, financial data, analyst opinions, or long-term investment research.
| Platform | Best For | Main Strength |
|---|---|---|
| TradingView | Active traders | Advanced charts, indicators, technical analysis, and trading-focused workflows |
| Koyfin | Macro and market research | Market dashboards, economic data, asset-class analysis, and visualization |
| TIKR | Fundamental research | Company financials, estimates, historical data, and valuation research |
| Seeking Alpha | Investor research | Earnings analysis, analyst opinions, financial metrics, and investment ideas |
| Morningstar | Long-term investors | Fundamental research, fund analysis, valuation, and portfolio-oriented research |
When an Alternative May Be Better
| Your Priority | Consider |
|---|---|
| Advanced technical charting | TradingView |
| Macro and economic analysis | Koyfin |
| Deep company financials | TIKR |
| Analyst and investor opinions | Seeking Alpha |
| Funds, ETFs, and long-term research | Morningstar |
| Fast stock discovery and screening | Finviz |
| Fundamental screening and portfolio analysis | Stock Rover |
The important point is that an alternative is not automatically better. It is better only when its strengths match your actual research process.
Frequently Asked Questions
Is Finviz better than Stock Rover?
Finviz can be better if your main priority is fast stock discovery, visual market analysis, and technical screening. It is especially useful when you want to scan a large universe and quickly identify stocks that meet specific technical or market criteria.
Stock Rover is generally better when you need deeper fundamental research and portfolio analysis. The right choice therefore depends more on your workflow than on which platform has more features.
Is Stock Rover better than Finviz?
Stock Rover is the stronger choice for investors who need detailed fundamental data, historical analysis, advanced screening, company comparisons, and portfolio management.
Finviz has an advantage when speed and visual market scanning matter more. So Stock Rover is not simply a replacement for Finviz; the platforms are optimized around different research priorities.
Which is better for long-term investing?
Stock Rover is generally the better fit for long-term investing.
Long-term investors often need to evaluate business quality, valuation, profitability, growth, financial strength, dividends, and historical trends. Stock Rover’s deeper fundamental research and portfolio tools are better aligned with that process.
Finviz can still be useful for finding initial ideas before performing deeper research elsewhere.
Which is better for day trading?
Finviz is generally better suited to a day-trading discovery workflow.
Its fast screening and visual market tools can help traders identify stocks based on price movement, volume, market capitalization, technical characteristics, and other short-term criteria.
However, neither platform should be treated as a complete trading execution system. Active traders may prefer a dedicated charting and brokerage platform alongside their screening tools.
Which has the better stock screener?
There is no universal winner.
Finviz is attractive for fast, straightforward market screening, particularly when technical and visual filters are important.
Stock Rover is stronger for investors who want more sophisticated fundamental screening, historical analysis, equations, custom metrics, and deeper research criteria.
If you primarily screen for price and technical characteristics, start with Finviz. If your screen depends heavily on financial fundamentals, Stock Rover is usually the better fit.
Which is better for fundamental analysis?
Stock Rover.
This is one of the clearest differences between the two platforms. Stock Rover is designed around detailed fundamental research, including valuation, profitability, growth, financial strength, dividends, historical financial information, and company comparison.
Finviz remains useful for quickly filtering companies before conducting deeper research, but Stock Rover is better suited to the actual fundamental-analysis stage.
Is Finviz Elite worth it?
Finviz Elite can be worth paying for if you use Finviz frequently and need features beyond its free experience.
The value is highest for users who benefit from real-time market data, advanced screening, alerts, exports, enhanced charts, and additional market information.
If you only use Finviz occasionally to browse stocks or check the market heat map, the free version may be enough. The best test is simple: identify which Elite features you would actually use every week before subscribing.
Is Stock Rover worth it?
Stock Rover can be worth it for investors who regularly perform detailed fundamental research or manage a portfolio and need more advanced screening and analysis.
Its paid tiers add progressively deeper data, historical information, screening capabilities, research tools, and portfolio functionality. The value depends heavily on your strategy.
For a casual investor who checks a few companies occasionally, paying for the highest tier may be unnecessary. For someone building repeatable value, growth, dividend, or quantitative screens, the additional research depth can be much more useful.
Is Finviz free?
Yes. Finviz offers a free version, which is useful for basic market discovery and screening.
Finviz Elite is the paid version and adds capabilities such as real-time data, enhanced charts, advanced screening, alerts, exports, and other research features.
The free version is therefore a reasonable starting point if you want to understand the platform before deciding whether its paid features justify the cost.
Is Stock Rover free?
Yes, Stock Rover offers a free option, but its more advanced research and screening capabilities are available through paid plans.
The free experience can be useful for getting familiar with the platform. Investors who need more metrics, longer historical data, advanced screening, and expanded portfolio capabilities will generally need a paid tier.
Can you use Finviz and Stock Rover together?
Yes. In fact, combining them can make sense for investors who want to separate stock discovery from deeper research.
A simple workflow is:
Finviz → Discover candidates → Stock Rover → Analyze fundamentals → Compare companies → Stock Rover → Monitor portfolio
This avoids forcing one platform to handle every part of the investment process.
Which platform is better for dividend investing?
Stock Rover is generally the better choice for serious dividend research.
Dividend investors often need more than a high dividend yield. They may want to evaluate payout ratios, dividend growth, profitability, financial strength, historical dividend behavior, and the sustainability of distributions.
Stock Rover’s deeper fundamental and historical research capabilities make it better suited to this type of analysis.
Finviz can still be useful for quickly identifying dividend-paying stocks and creating an initial shortlist, but Stock Rover is better positioned for evaluating the underlying businesses.
Final Verdict — Finviz vs Stock Rover
So, which one should you choose: Finviz or Stock Rover?
The answer depends on what you need your research platform to do.
Finviz is the better choice when your workflow starts with fast market discovery, visual analysis, and technical screening. Stock Rover is the stronger choice when you need deep fundamental research, historical financial data, company comparison, and portfolio analysis.
Choose Finviz If…
- ☐ You want to discover stocks quickly
- ☐ Technical filters are an important part of your strategy
- ☐ You like visual market analysis and heat maps
- ☐ You regularly scan large numbers of stocks
- ☐ You prefer a relatively straightforward research workflow
- ☐ Your process starts with finding market opportunities rather than deeply analyzing every company
Typical workflow:
Market → Screen → Visualize → Chart → Watchlist
Choose Stock Rover If…
- ☐ You primarily invest for the long term
- ☐ Fundamental analysis drives your decisions
- ☐ You need historical financial information
- ☐ You compare companies using multiple financial metrics
- ☐ You build advanced fundamental screens
- ☐ You want detailed portfolio analytics and monitoring
- ☐ Dividend, value, growth, or quality analysis is central to your strategy
Typical workflow:
Screen → Research → Compare → Analyze → Portfolio → Monitor
Choose Both If…
You do not have to treat Finviz and Stock Rover as competing replacements.
A combined workflow can be more efficient for investors who need both fast discovery and deep research:
Finviz → Discover candidates → Stock Rover → Analyze fundamentals → Compare → Invest → Stock Rover → Monitor
For example, Finviz can help you narrow thousands of US stocks down to 20 potential candidates. Stock Rover can then help you evaluate those candidates using valuation, growth, profitability, financial strength, historical data, and portfolio context.
Overall Winner
There is no universal winner.
If the question is “Which platform is better for fast stock discovery and technical screening?”, Finviz gets the edge.
If the question is “Which platform is better for fundamental research and portfolio analysis?”, Stock Rover gets the edge.
For a long-term fundamental investor, Stock Rover is the better single-platform choice. For a trader or market scanner, Finviz is likely the better fit.
For investors who want both rapid idea generation and detailed research, using Finviz + Stock Rover together may provide the most complete workflow.
The best platform is therefore not the one with the longest feature list. It is the one that fits the way you actually make investment decisions.
Recommended Comparison Tables
Table 1 — Quick Comparison
| Feature | Finviz | Stock Rover |
|---|---|---|
| Fast stock discovery | Excellent | Very Good |
| Visual market analysis | Excellent | Good |
| Technical screening | Strong | Strong |
| Fundamental screening | Strong | Excellent |
| Historical fundamentals | Limited compared with Stock Rover | Excellent |
| Company comparison | Good | Excellent |
| Portfolio analysis | Limited | Excellent |
| Brokerage integration | Limited | Strong |
| Best for | Traders and fast screeners | Fundamental and long-term investors |
Table 2 — Screener Comparison
| Screening Area | Finviz | Stock Rover |
|---|---|---|
| Technical filters | Strong | Strong |
| Fundamental filters | Strong | Excellent |
| Custom filters | Strong | Excellent |
| Historical screening | More limited | Advanced on higher tiers |
| Equations/custom metrics | Limited | Advanced |
| Visual screening | Excellent | Good |
| Best use | Fast idea discovery | Deep candidate selection |
Table 3 — Fundamental Research
| Research Area | Finviz | Stock Rover |
|---|---|---|
| Valuation metrics | Yes | Extensive |
| Growth metrics | Yes | Extensive |
| Profitability | Yes | Extensive |
| Financial strength | Yes | Extensive |
| Historical fundamentals | More limited | Much deeper |
| Dividend analysis | Good | Excellent |
| Company comparison | Good | Excellent |
| Long-term research | Good | Excellent |
Table 4 — Portfolio Features
| Portfolio Feature | Finviz | Stock Rover |
|---|---|---|
| Portfolio tracking | Limited | Strong |
| Performance analysis | Limited | Strong |
| Risk analysis | Limited | Strong |
| Dividend/income analysis | Limited | Strong |
| Brokerage integration | Limited | Strong |
| Portfolio monitoring | Basic | Advanced |
| Best for portfolio management | No | Yes |
Table 5 — Pricing
Pricing should always be checked immediately before publication because subscription plans, features, and promotional offers can change.
| Platform | Free Option | Paid Structure |
|---|---|---|
| Finviz | Yes | Finviz Elite |
| Stock Rover | Yes | Premium, Premium Plus, Ultimate and Ultimate Pro |
For the currently researched pricing, Finviz Elite is offered at $39.50/month or $299.50/year, while Stock Rover’s annual-billing tiers range from $29/month equivalent for Premium to $149/month equivalent for Ultimate Pro.
The important comparison is not simply the subscription price. Compare the specific features you will actually use.
Table 6 — Investor Type
| Investor Type | Better Fit |
|---|---|
| Beginner exploring stocks | Finviz |
| Day trader | Finviz |
| Swing trader | Finviz |
| Long-term investor | Stock Rover |
| Value investor | Stock Rover |
| Dividend investor | Stock Rover |
| Fundamental investor | Stock Rover |
| Quantitative investor | Stock Rover |
| Investor using both technical + fundamental workflows | Both |
Table 7 — Final Winner by Category
| Category | Winner |
|---|---|
| Fast stock discovery | Finviz |
| Visual market analysis | Finviz |
| Technical-first screening | Finviz |
| Fundamental research | Stock Rover |
| Historical financial analysis | Stock Rover |
| Portfolio management | Stock Rover |
| Long-term investing | Stock Rover |
| Combined workflow | Both |
Finviz Is Probably Better for You If…
- ☐ You want to find stock ideas quickly
- ☐ You frequently use technical filters
- ☐ You like heat maps and visual market data
- ☐ You scan many stocks at once
- ☐ You prefer speed over research depth
- ☐ Your first step is usually screening rather than detailed fundamental analysis
Stock Rover Is Probably Better for You If…
- ☐ You research businesses before investing
- ☐ You need historical financial data
- ☐ You compare several companies in depth
- ☐ You rely on valuation and profitability metrics
- ☐ You build sophisticated fundamental screens
- ☐ You manage an investment portfolio
- ☐ You focus on long-term, value, growth, or dividend investing
Before Paying for Either Platform…
- ☐ Identify your investment style
- ☐ Determine whether you need technical or fundamental research
- ☐ Test the free version
- ☐ Compare the specific features you actually need
- ☐ Check current pricing
- ☐ Test your real stock-screening workflow
- ☐ Evaluate your portfolio-management requirements
Expert Tip #1: Don’t confuse the number of available metrics with actual research quality. More data is useful only when it helps you make better-informed decisions.
Expert Tip #2: Test both platforms using the same stock-screening criteria before subscribing. This gives you a much more realistic comparison than relying on feature lists.
Expert Tip #3: Choose based on your workflow, not the platform with the longest feature list. A feature you never use has little practical value.
Expert Tip #4: Financial platform pricing and features change. Verify current pricing, plan limits, and included features before publishing or purchasing.
Expert Tip #5: A stock screener helps generate candidates; it does not replace investment due diligence. A stock appearing in a screen is a starting point, not a buy signal.
Practical Examples
Example 1 — Find Undervalued Profitable US Companies
Suppose your goal is to find profitable US companies trading at relatively attractive valuations.
Use the same criteria on both platforms, such as:
- US-listed companies
- Positive earnings
- Positive revenue growth
- Strong profitability
- Reasonable P/E
- Reasonable price-to-sales ratio
- Minimum market capitalization
Finviz can quickly narrow the market using these filters and provide an initial candidate list.
Stock Rover can take the process further by examining historical fundamentals, valuation trends, profitability, financial strength, and other company-specific metrics.
Workflow winner: Finviz for discovery; Stock Rover for deeper validation.
Example 2 — Find High-Growth Stocks
For growth investing, start with criteria such as:
- Revenue growth
- Earnings growth
- EPS growth
- Positive profitability
- Minimum market capitalization
Finviz is useful for quickly identifying companies matching the basic growth profile.
Stock Rover becomes more useful when you want to determine whether that growth is consistent, how the company’s valuation compares with its growth, and how the business has performed historically.
Workflow winner: Both, with Stock Rover having the advantage for deeper fundamental evaluation.
Example 3 — Find Momentum Stocks
A momentum screen might use:
- Strong recent performance
- Relative strength
- High trading volume
- Price above selected moving averages
- Positive short-term price movement
This is where Finviz can be particularly efficient because technical and market filters are central to the workflow.
Once candidates are identified, you can move to charts or another trading-focused platform for further technical analysis.
Workflow winner: Finviz.
Example 4 — Find Dividend Stocks
A dividend screen could include:
- Dividend yield
- Dividend growth
- Positive earnings
- Sustainable payout characteristics
- Strong profitability
- Financial strength
Finviz can help generate an initial list quickly.
Stock Rover is better suited to the deeper stage because dividend investors often need to evaluate the underlying company’s financial condition and historical dividend characteristics rather than simply choosing the highest yield.
Workflow winner: Stock Rover for deeper dividend research.
Example 5 — Analyze an Existing Portfolio
Suppose you already own 15 US stocks and want to understand portfolio performance, risk, income, diversification, and the underlying fundamentals.
This is where Stock Rover has the clearer advantage.
Rather than starting with a market-wide screen, you are asking questions about assets you already own and how they fit together.
Workflow winner: Stock Rover.
Case Study — One Stock, Two Research Workflows
The clearest way to understand Finviz vs Stock Rover is to follow the same company through both platforms.
For an original case study, select one publicly traded US company and apply identical research criteria to both platforms. The purpose is to compare the research workflow, not to prove that one platform produces a better investment outcome.
Finviz Workflow
Screen → Discover → Technical Review → Candidate
Start by applying the predefined screening criteria.
For example:
- Market capitalization
- Valuation
- Earnings growth
- Recent performance
- Volume
- Technical trend
Finviz quickly answers:
“Which companies match my initial criteria?”
After reviewing the resulting list, select one candidate for deeper investigation.
Stock Rover Workflow
Fundamentals → Historical Data → Valuation → Portfolio Context
Take the same company into Stock Rover and examine:
- Revenue and earnings trends
- Profitability
- Valuation
- Financial strength
- Historical fundamentals
- Dividend characteristics, where relevant
- Relative company performance
- Portfolio impact
Stock Rover answers a different question:
“Does this company still make sense after deeper research?”
What This Demonstrates
The two workflows are not necessarily competing.
Finviz is particularly effective at reducing a large market universe to a manageable shortlist.
Stock Rover is particularly useful when you want to spend more time understanding the companies on that shortlist.
That distinction is the real story behind Finviz vs Stock Rover:
Finviz helps you find candidates. Stock Rover helps you investigate them.
And when your strategy requires both stages, using both platforms can be more practical than choosing only one.
Visual Plan
Visual 1 — Hero Featured Image
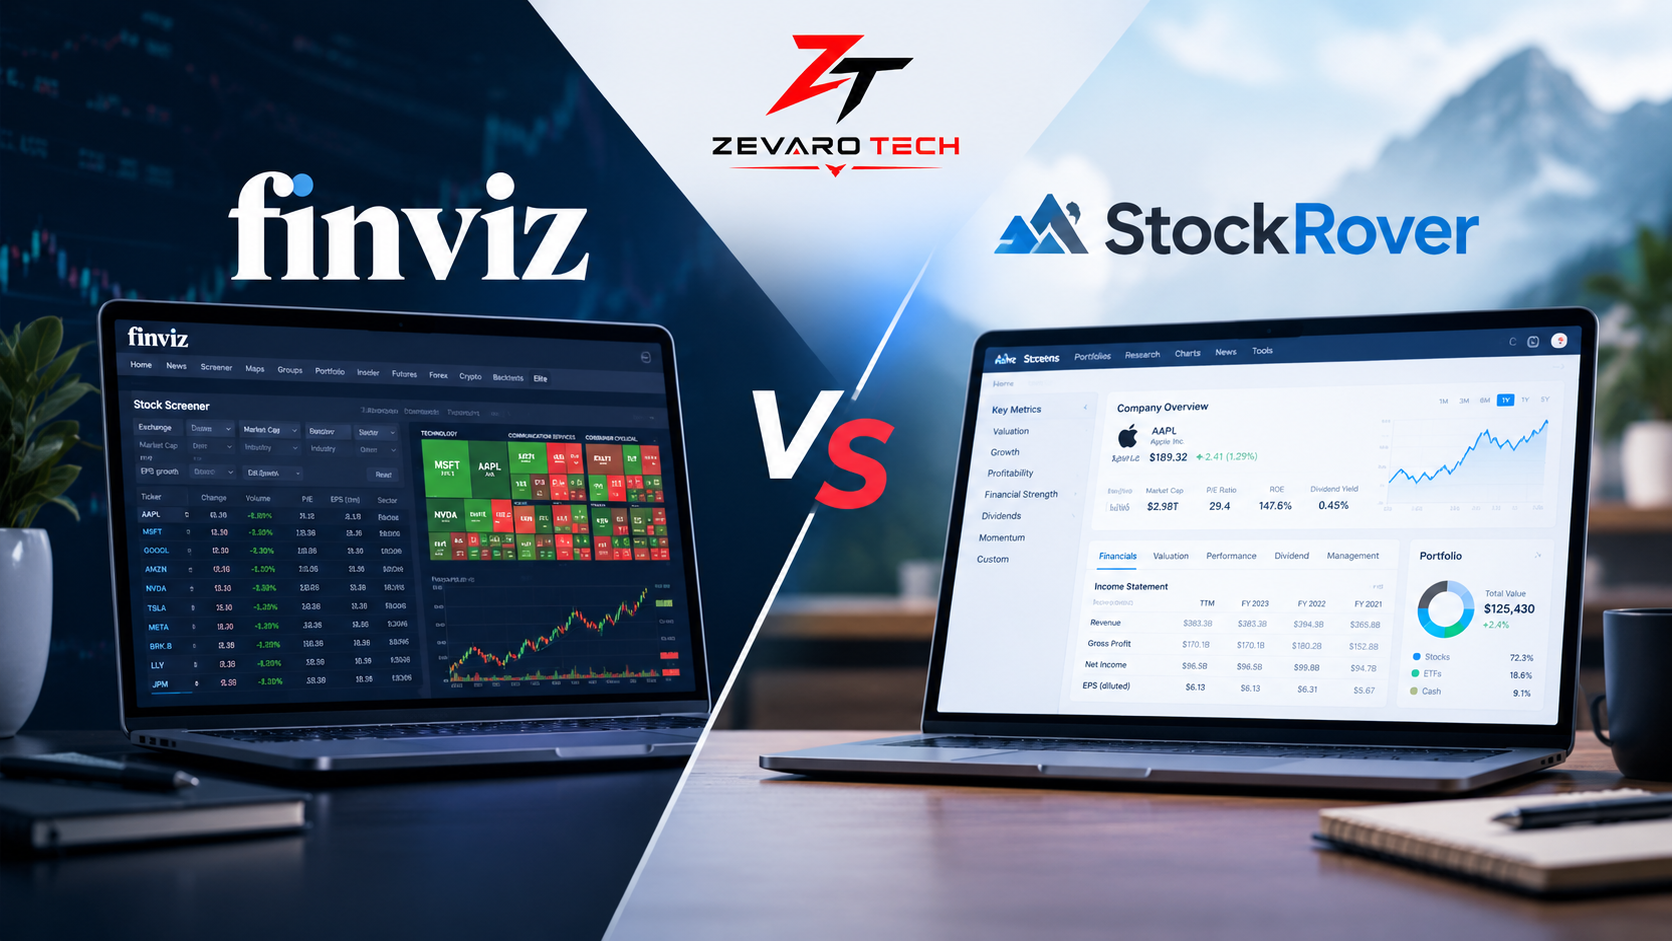
Concept: A premium split-screen visual representing Finviz vs Stock Rover.
Left: Finviz-inspired market screener, heat map, charts, and technical signals.
Right: Stock Rover-inspired fundamental dashboard, financial metrics, valuation data, and portfolio analytics.
Center:
FINVIZ vs STOCK ROVER
Style: Premium financial-tech editorial design with a dark blue/blue/white palette, subtle gradients, realistic dashboard elements, clean typography, and minimal text.
Visual 2 — Quick Comparison Infographic
Create a simple two-column visual:
FINVIZ
- Speed
- Visualization
- Technical Screening
- Market Discovery
VS
STOCK ROVER
- Fundamentals
- Historical Data
- Company Research
- Portfolio Analysis
The purpose is to communicate the core distinction within a few seconds.
Visual 3 — Finviz Screener Screenshot
Use an actual Finviz interface screenshot showing a relevant screening workflow.
Placement: Finviz screener section.
Annotate only the important areas, such as filters, results, charts, or market visualization.
Visual 4 — Stock Rover Screener Screenshot
Use an actual Stock Rover interface screenshot showing a comparable screening workflow.
Placement: Stock Rover screener section.
Keep the annotation style consistent with the Finviz screenshot.
Visual 5 — Side-by-Side Screener Comparison
Show:
Same Criteria → Finviz Results → Stock Rover Results
Use exactly the same stock universe and screening criteria wherever technically possible.
This is one of the most valuable visuals because readers can see how each platform approaches the same research task.
Visual 6 — Workflow Diagram
FINVIZ
Market → Screen → Visualize → Chart → Watchlist
STOCK ROVER
Screen → Research → Compare → Analyze → Portfolio → Monitor
This visual should emphasize that the platforms solve different stages of the investment workflow.
Visual 7 — Investor Decision Tree
Start with:
What type of investor are you?
↓
Technical / fast screening → Finviz
Fundamental / long-term research → Stock Rover
Both workflows → Use Both
Keep the decision tree simple enough to understand without reading the surrounding article.
Visual 8 — Pricing Comparison Graphic
Show the pricing progression for both platforms:
FINVIZ
Free → Elite
STOCK ROVER
Free → Premium → Premium Plus → Ultimate → Ultimate Pro
Add the current price beside each paid tier only after verifying the live pricing page.
Visual 9 — Hands-On Test Results Chart
If you score the platforms, document the methodology before publishing.
Recommended dimensions:
- Ease of use
- Screening depth
- Fundamental research
- Technical screening
- Portfolio analysis
- Visualization
- Workflow speed
Do not present arbitrary scores as objective facts.
A better approach is to explain what each score means—for example, whether a platform completed a defined task faster, exposed more relevant data, or required fewer workflow steps.
The goal is to make the scoring repeatable and transparent, not simply to declare a winner.